Contents
Observability is the process of making a system’s internal state more transparent. Systems are made observable by the data they produce, which in turn helps you to determine if your infrastructure or application is healthy and functioning normally.
What data is collected
The three fundamental types of data that are collected are metrics, logs, and traces.
Metrics
A metric is a numeric measurement that is timestamped to indicate when it was collected. If you track an application or system, you might measure:
- How many system resources are currently being used, such as memory or storage
- How long it takes a particular service to respond to a request
- How many users are accessing the application right now
Metrics can tell you how often something is failing, but not why.
Logs
Logs are time-stamped records of events that happen over time, such as error log files. Logs help you understand the behavior of infrastructure and applications as well as of users and business. For example, you can use logs to answer these questions:
- How many requests are processed per second?
- What percentage of requests are failing?
- Of users who visited in the last month, how many of them returned this month?
- How many distinct users are visiting the site per day?
Logs often contain the root cause of a failure or issue. Logs must be collected together (called aggregation), stored, and indexed.
Traces
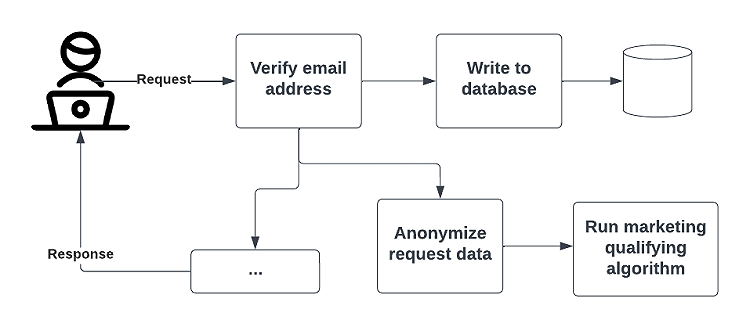
A trace provides end-to-end insight because it tracks a system request as it travels through multiple locations/components of a system that is distributed or based on microservices. Traces are made up of spans. Spans record how long each part of a request takes, such as this simple request shown in the following process diagram
The following graphic shows the root span that records the length of the entire request. A root span has child spans for each part of processing the request.
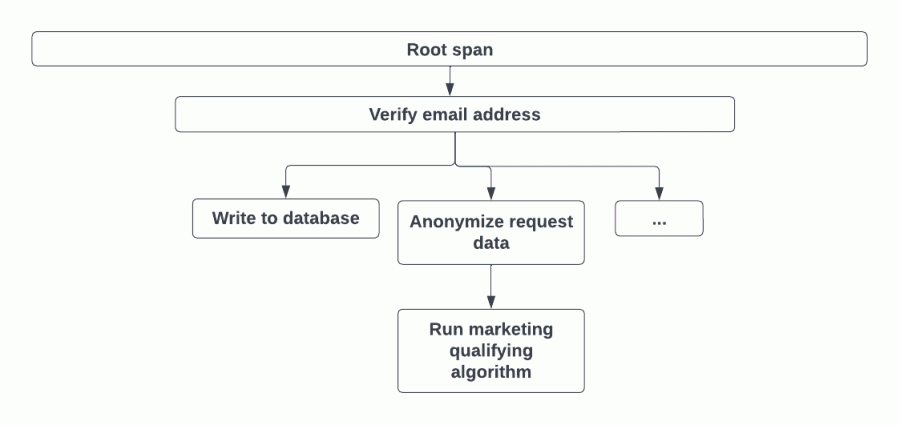
Traces make it easier to understand root causes and locate which parts of the system are slow or having other problems.
Profiles
A profile is a measurement of the resource usage and duration of an application’s function. A continuous profile continuously gathers this data.
You can use continuous profiling to identify details about your application’s performance, down to the code level.